Plot areal (regional) data on a map.
Examples
# \donttest{
if (requireNamespace("sf", quietly = TRUE)) {
nc <- sf::st_read(system.file("shape/nc.shp", package = "sf"), quiet = TRUE)
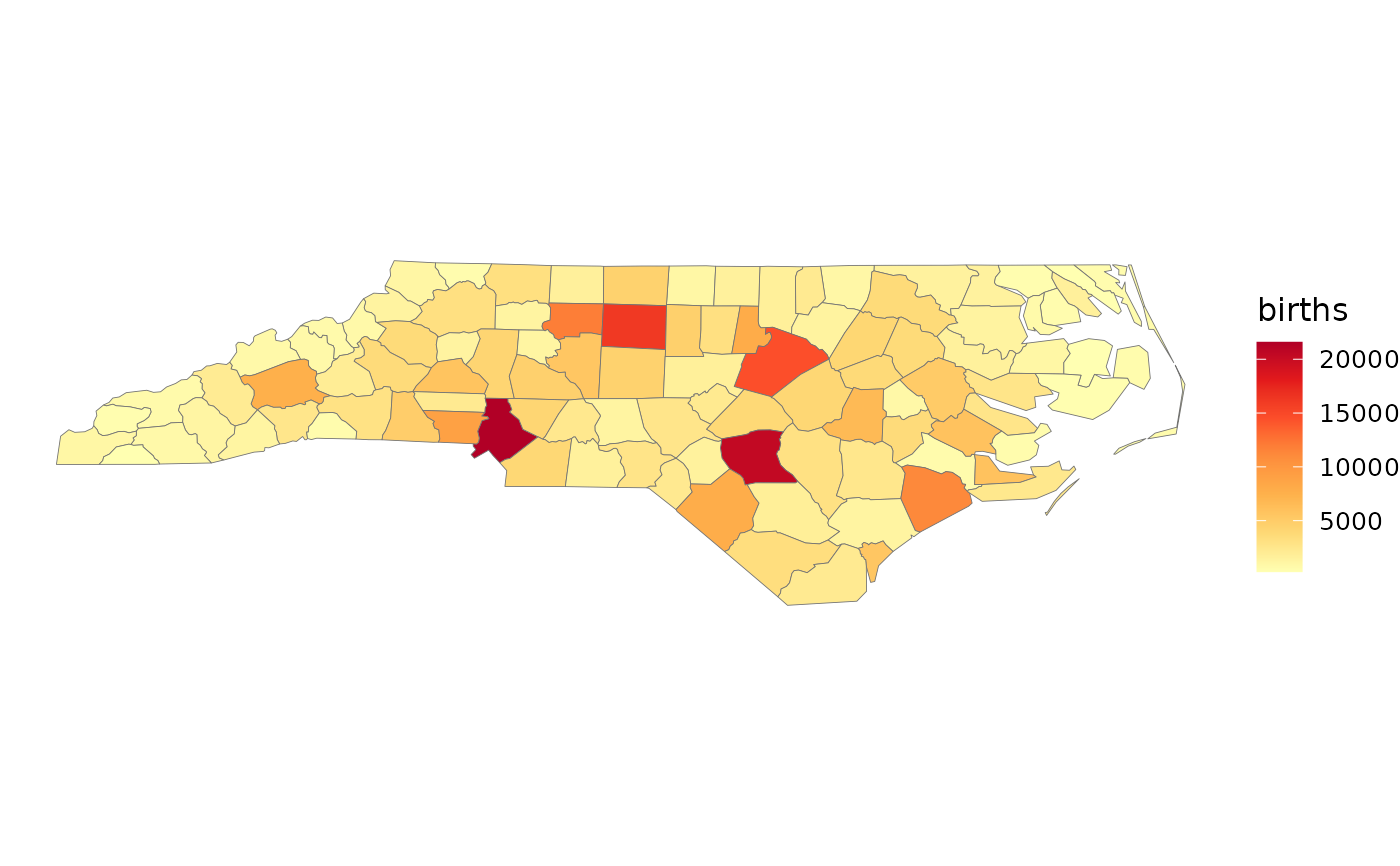
areal.plot(nc, nc$BIR74, title = "births")
}
 # }
Plot areal (regional) data on a map.
# \donttest{
if (requireNamespace("sf", quietly = TRUE)) {
nc <- sf::st_read(system.file("shape/nc.shp", package = "sf"), quiet = TRUE)
areal.plot(nc, nc$BIR74, title = "births")
}
# }